Oxygen
 |
Oxygen (O2) is essential for nearly all multicellular life. Subsurface oxygen concentrations reflect a balance between supply through circulation and ventilation and consumption by respiratory processes. Changes in either of these processes is susceptible to lead to changes in O2 distribution. A global ocean O2 observing network will act as a sensitive early warning system for trends that climate change is causing. Ocean deoxygenation (decline in O2 concentration) is under way in part because of ocean warming and increased stratification, but also because of increased nutrient loads in the coastal ocean. Deoxygenation has been largely under the radar to most people including policy advisers and decision makers. Yet it is deoxygenation that will have profound implications not just for ecosystems but also for communities and economies that depend on a healthy ocean. | |
| Domain: | Ocean | |
| Subdomain: | Biogeochemical | |
| Scientific Area: | Biosphere | |
| ECV Steward: | ||
| Products: | Dissolved Oxygen Concentration | |
Oxygen concentrations in the ocean
|
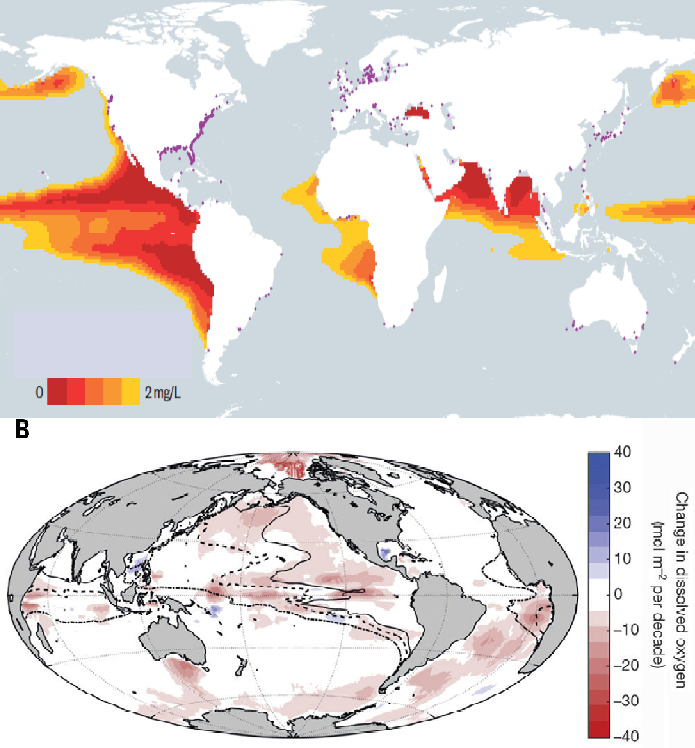
(A) Global map showing coastal sites (purple dots) and open ocean sites (red to yellow, at 300 m of depth) where oxygen levels are below 2 mg L-1 (Adapted from Breitburg et al., 2018). (B) Change in oxygen content of the global ocean in mol O2 m−2 decade−1. Reference: Breitburg, D., et al.(2018): "Declining oxygen in the global ocean and coastal waters." Science, Vol. 359, Issue 6371, doi:10.1126/science.aam7240. |
ECV Products and Requirements
These products and requirements reflect the Implementation Plan 2022 (GCOS-244).
The requirements are found in the complete 2022 ECVs Requirements document as well: ECV Oxygen.
| Products | Dissolved Oxygen Concentration | |||
| Coastal | ||||
| (*) | Unit | Values | ||
| Horizontal Resolution | G | km | 300 | 1-100 |
| B | ||||
| T | 2000 | 300 | ||
| Vertical Resolution | G | m | ||
| B | ||||
| T | ||||
| Temporal Resolution | G | monthly | ||
| B | ||||
| T | decadal | |||
| Timeliness | G | month | 6 | |
| B | ||||
| T | 12 | |||
| Required Measurement Uncertainty (2-sigma) | G | μmol kg⁻¹ |
0.5 | |
| B | ||||
| T | 2 | |||
| Stability | G | |||
| B | ||||
| T | ||||
(*) Goal (G): an ideal requirement above which further improvements are not necessary. Breakthrough (B): an intermediate level between threshold and goal which, if achieved, would result in a significant improvement for the targeted application. The breakthrough value may also indicate the level at which specified uses within climate monitoring become possible. It may be appropriate to have different breakthrough values for different uses. Threshold (T): the minimum requirement to be met to ensure that data are useful
Data Sources
This list provides sources for openly accessible data sets with worldwide coverage for which metadata is available. It is curated by the respective GCOS ECV Steward(s). The list does not claim to be complete. Anyone with a suitable dataset who wishes it to be added to this list should contact the GCOS Secretariat.
- CLIVAR and Carbon Hydrographic Data Office (CCHDO)
- OceanSITES Global Data Assembly Centres
http://www.oceansites.org/data/index.html
- Global Ocean Data Analysis Project (GLODAPv2)


