Nitrous Oxide


N2O concentration and flux in the ocean
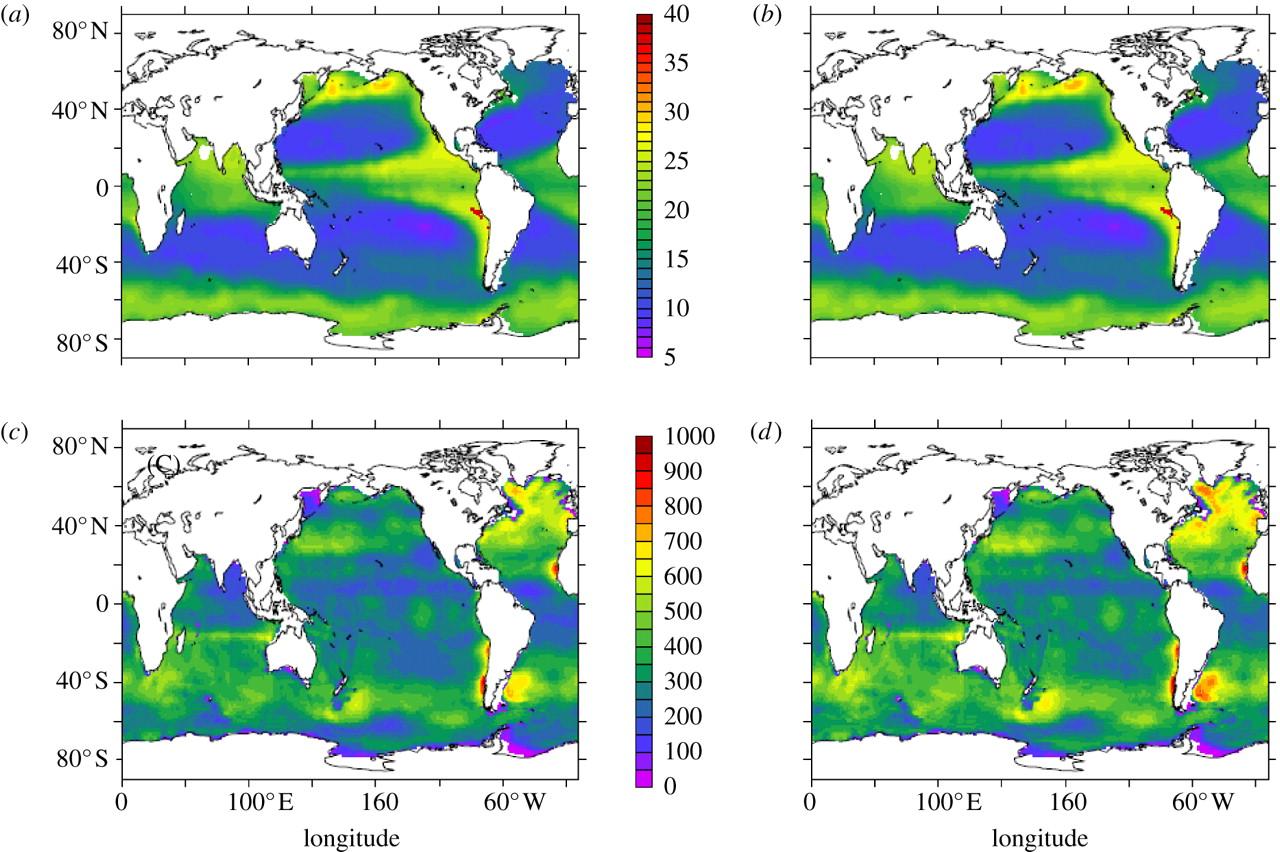
Figure: Global N2O (nmol kg–1) distribution in 200 m depth estimated using depth/AOUR-depending N2O production rates (a) and using temperature/AOUR-depending N2O production rates (AOUR = apparent oxygen uitilization rate) (b). (a,b) White areas in the Arabian Sea represent concentrations exceeding 40 nmol kg–1. Annual N2O production (μmol m–2 yr–1) via nitrification integrated over the water column estimated using (c) depth/AOUR relationship and (d) temperature/AOUR relationship. Reference: Freing, A., Wallace, D. W. R., and Bange, H. W. (2012): Global oceanic production of nitrous oxide, Philosophical Transactions of the Royal Society B-Biological Sciences, 367, 1245-1255, 10.1098/rstb.2011.0360. |
ECV Products and Requirements
These products and requirements reflect the Implementation Plan 2022 (GCOS-244).
The requirements are found in the complete 2022 ECVs Requirements document as well: ECV Nitrous Oxide.
| Products | Interior Ocean Nitrous Oxide N2O | N2O Air-sea Flux | ||||
| Coastal | Coastal | |||||
| (*) | Unit | Values | Values | |||
| Horizontal Resolution | G | km | <2000 | <500 | <2000 | <500 |
| B | ||||||
| T | 2000 | 2000 | ||||
| Vertical Resolution | G | |||||
| B | ||||||
| T | ||||||
| Temporal Resolution | G | month | 3 | 3 | weekly to monthly | |
| B | ||||||
| T | 3 | weekly to monthly | decadal | |||
| Timeliness | G | y | 1 | 1 | ||
| B | ||||||
| T | 2 | 2 | ||||
| Required Measurement Uncertainty (2-sigma) | G | % | <1 | <1 | ||
| B | ||||||
| T | 5 | 5 | ||||
| Stability | G | |||||
| B | ||||||
| T | ||||||
(*) Goal (G): an ideal requirement above which further improvements are not necessary. Breakthrough (B): an intermediate level between threshold and goal which, if achieved, would result in a significant improvement for the targeted application. The breakthrough value may also indicate the level at which specified uses within climate monitoring become possible. It may be appropriate to have different breakthrough values for different uses. Threshold (T): the minimum requirement to be met to ensure that data are useful
Data sources
This list provides sources for openly accessible data sets with worldwide coverage for which metadata is available. It is curated by the respective GCOS ECV Steward(s). The list does not claim to be complete. Anyone with a suitable dataset who wishes it to be added to this list should contact the abombelli wmo [dot] int (GCOS Secretariat).
- MarinE MethanE and NiTrous Oxide (MEMENTO) database

