Subsurface Currents


Geostrophic flow from Argo and Altimeter
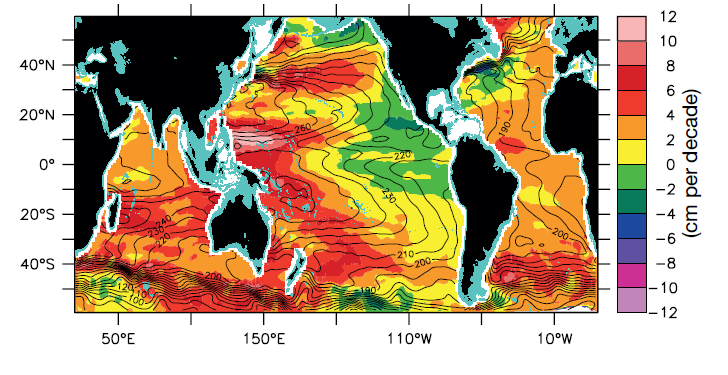
Figure: Mean steric height of the sea surface relative to 2000 decibars (black contours at 10cm intervals) shows the pattern of flow for the Argo era (2004-2012) based on Argo profile data, updated from Roemmich and Gilson (2009). The sea surface height (SSH) trend (cm per decade, colour shading) for the period 1993-2011 is based on the AVISO altimetry ‘reference’ product (Ducet et al., 2000). Spatial gradients in the SSH trend, divided by the (latitude-dependant) Coriolis parameter, are proportional to changes in surface geostrophic velocity. For display, the mean steric contours and SSH trends are spatially smoothed over 5 degrees longitude and 3 degrees latitude. Reference: IPCC 5th Assessment Report, WG1 Chapter 3: Ocean Observations Source (13/12/2017): http://rstb.royalsocietypublishing.org/content/367/1593/1245 |
ECV Products and Requirements
These products and requirements reflect the Implementation Plan 2022 (GCOS-244).
The requirements are found in the complete 2022 ECVs Requirements document as well: ECV Subsurface Currents.
| Products | Vertical Mixing | |||
| Upper Ocean | Deep ocean | |||
| (*) | Unit | Values | ||
| Horizontal Resolution | G | km | 10 | |
| B | ||||
| T | 100 | |||
| Vertical Resolution | G | m | 1 | 10 |
| B | ||||
| T | 10 | 100 | ||
| Temporal Resolution | G | d | 1 | |
| B | 7 | |||
| T | 30 | |||
| Timeliness | G | d | 1 | |
| B | ||||
| T | 30 | |||
| Required Measurement Uncertainty (2-sigma) | G | 0.02 | ||
| B | ||||
| T | 0.1 | |||
| Stability | G | |||
| B | ||||
| T | ||||
(*) Goal (G): an ideal requirement above which further improvements are not necessary. Breakthrough (B): an intermediate level between threshold and goal which, if achieved, would result in a significant improvement for the targeted application. The breakthrough value may also indicate the level at which specified uses within climate monitoring become possible. It may be appropriate to have different breakthrough values for different uses. Threshold (T): the minimum requirement to be met to ensure that data are useful
Data sources
This list provides sources for openly accessible data sets with worldwide coverage for which metadata is available. It is curated by the respective GCOS ECV Steward(s). The list does not claim to be complete. Anyone with a suitable dataset who wishes it to be added to this list should contact the abombelli wmo [dot] int (GCOS Secretariat).
- National Center for Environmental Information, Global Ocean Currents Database (GOCD)

