Ozone


Global Ozone Change
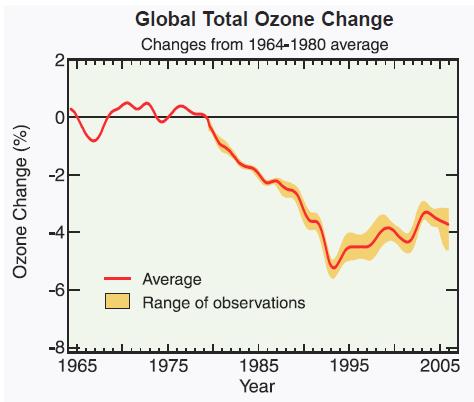
Figure: Changes in global total column ozone. Global total ozone measured by satellite instruments decreased by about 5% between 1980 and 1993, relative to the average value for 1964-1980. The steep drop during 1991-1993 is attributed to increased stratospheric aerosols injected by the eruption of Mt. Pinatubo in 1991. The aerosol effects slowly dissipated during the next decade, but global total ozone remained about 4% lower than in 1964-1980.igure: Global total ozone changes. Global total ozone values decreased by an average of a few percent in the last two decades, as measured by satellite instruments. In the top panel, global ozone changes are compared with average global ozone found in the period of 1964 to 1980. Between 1980 and 2006, the largest decreases occurred following the volcanic eruption of Mt. Pinatubo in 1991. Source: NOAA Earth System Research Laboratory. |
ECV Products and Requirements
These products and requirements reflect the Implementation Plan 2022 (GCOS-244).
The requirements are found in the complete 2022 ECVs Requirements document as well: ECV Ozone.
| Products | Ozone mole fraction in the Troposphere | Ozone mole fraction in the Upper Troposphere/ Lower Stratosphere (UTLS) | Ozone mole fraction in the Middle and Upper Stratosphere | Ozone Tropospheric Column | Ozone Stratospheric Column | Ozone Total Column | ||
| (*) | Unit | Values | Values | Values | Values | Values | Values | |
| Horizontal Resolution | G | km | 1 | 10 | 20 | 5 | 20 | 20 |
| B | 20 | 50 | 100 | 20 | 100 | 100 | ||
| T | 100 | 200 | 500 | 100 | 500 | 500 | ||
| Vertical Resolution | G | km | 1 | 0.5 | 1 | - | - | - |
| B | 3 | 1 | 3 | - | - | - | ||
| T | 5 | 3 | 10 | - | - | - | ||
| Temporal Resolution | G | d | 1/24 | 1/4 | 1/4 | 1/24 | 1/24 | 1/24 |
| B | 1/4 | 1 | 1 | 1/4 | 1 | 1 | ||
| T | 30 | 30 | 30 | 30 | 30 | 30 | ||
| Timeliness | G | d | 1/24 | 1/4 | 1/4 | 1/24 | 1/4 | 1 |
| B | 1 | 1 | 1 | 1 | 1 | 1 | ||
| T | 30 | 30 | 30 | 30 | 30 | 30 | ||
| Required Measurement Uncertainty (2-sigma) | G | % | 2 | 2 | 5 | 5 | 1 | 1 |
| B | 5 | 5 | 10 | 10 | 3 | 2 | ||
| T | 10 | 10 | 15 | 15 | 5 | 3 | ||
| Stability | G | %/decade | <1 | 1 | 1 | 1 | 1 | 1 |
| B | 2 | 2 | 2 | 2 | 2 | 2 | ||
| T | 3 | 3 | 3 | 3 | 3 | 3 |
(*) Goal (G): an ideal requirement above which further improvements are not necessary. Breakthrough (B): an intermediate level between threshold and goal which, if achieved, would result in a significant improvement for the targeted application. The breakthrough value may also indicate the level at which specified uses within climate monitoring become possible. It may be appropriate to have different breakthrough values for different uses. Threshold (T): the minimum requirement to be met to ensure that data are useful
Data sources
This list provides sources for openly accessible data sets with worldwide coverage for which metadata is available. It is curated by the respective GCOS ECV Steward(s). The list does not claim to be complete. Anyone with a suitable dataset who wishes it to be added to this list should contact the abombelli wmo [dot] int (GCOS Secretariat).
In Situ and Ground-Based Remote Sensing:
- World Ozone and Ultraviolet Radiation Data Centre (WOUDC)
- Earth System Research Laboratory Global Monitoring Division O3 data
- Network for the Detection of Atmospheric Composition Change (NDACC)
- Southern Hemisphere ADditional Ozonesondes (SHADOZ)
- World Data Centre for Reactive Gases (WDCRG)
Reanalysis:
- REANALYSES.ORG (Inventory for Reanalysis)
- Copernicus Atmospheric Monitoring Service (CAMS), MACC Reanalysis of global atmospheric composition, European Centre for Medium-Range Weather Forecasts (ECMWF)
- Monitoring Atmospheric Composition & Climate (MACC), European Centre for Medium-Range Weather Forecasts (ECMWF)
Satellite:
- Satellite ECV Inventory by the CEOS/CGMS Working Group on Climate (WGClimate)

