Permafrost


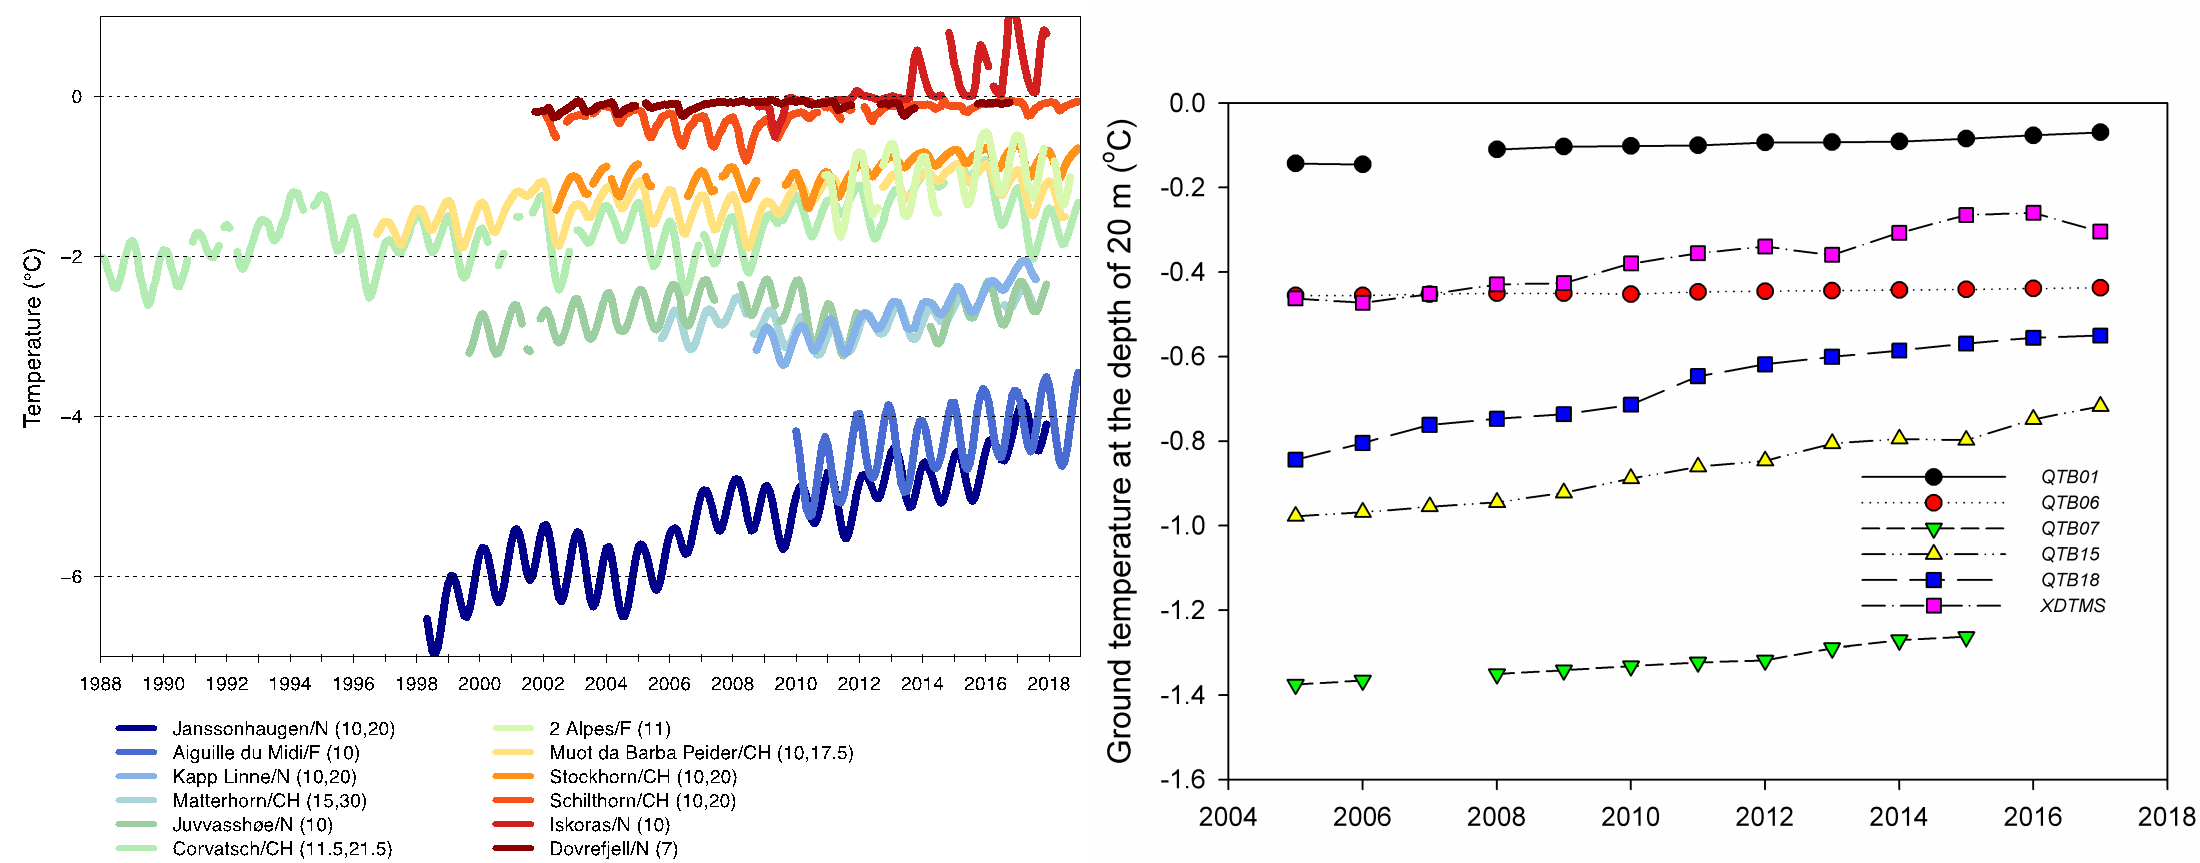
Permafrost Temperature Evolution
|
ECV Products and Requirements
These products and requirements reflect the Implementation Plan 2022 (GCOS-244).
The requirements are found in the complete 2022 ECVs Requirements document as well: ECV Permafrost.
| Products | °C | Permafrost Temperature (PT) | |
| (*) | Unit | Values | |
| Horizontal Resolution | G | N/A (Spatial distribution of boreholes) | Regular spacing |
| B | Transects / various settings | ||
| T | Characterization of bioclimate zones | ||
| Vertical Resolution: Borehole depth | G | Deeper than ZAA | |
| B | Down to ZAA | ||
| T | Below permafrost table | ||
| Vertical Resolution: Sensor spacing along borehole for continuous monitoring | G | m | Above ZAA: 0.2 |
| B | |||
| T | Above ZAA: 0.5 | ||
| Vertical Resolution: measuring interval for manual measurement | G | m | Below ZAA: 5 to 10 |
| B | |||
| T | Below ZAA: >10 | ||
| Temporal Resolution | G | Active layer: 1h; Down to ZAA: 1d; Below ZAA: 1 month | |
| B | Active layer: 1d; Down to ZAA: 1 month; Below ZAA: 1 year | ||
| T | Active layer: 1 month; Down to ZAA: 1 year; Below ZAA: 5 years | ||
| Timeliness | G | Weekly /real time | |
| B | 1 year | ||
| T | 5 years | ||
| Required Measurement Uncertainty | G | °C | 0.01 |
| B | 0.1 | ||
| T | 0.2 | ||
| Stability | G | °C | 0.01 |
| B | 0.05 | ||
| T | 0.1 | ||
| Products | cm | Active Layer Thickness (ALT) | m y-1 | Rock Glacier Velocity (RGV) | |||
| Spatial distribution of selected rock glaciers | Spatial resolution of the measurem ent. 1 value per selected rock glacier unit | ||||||
| (*) | Unit | Values | Unit | Values | Values | ||
| Horizontal Resolution | G | m | Regular spacing | Regional coverage | Flow field | ||
| B | Transects | Multiple sites in a defined regional context | Few discrete points | ||||
| T | sufficient sites to characterize each bioclimatic subzone | Isolated site | Velocity value at a point | ||||
| Vertical Resolution | G | cm | 2 | ||||
| B | 10 | ||||||
| T | 20 | ||||||
| Temporal Resolution | G | y | 1 (at end of thawing period) | y (Frequency and Observation time window) | 1 and 1 | ||
| B | 1 and <1 | ||||||
| T | 1 (at end of thawing period) | 2-5 and >1 | |||||
| Timeliness | G | y | 1 | month | 3 | ||
| B | |||||||
| T | 1 | 12 | |||||
| Required Measurement Uncertainty (2-sigma) | G | cm | 1/5 | % | 5 | ||
| B | 10 | ||||||
| T | 2/15 | 20 | |||||
| Stability | G | cm | 1 | y | with overlap several years | ||
| B | 5 | with overlap 1 year | |||||
| T | 10 | without overlap | |||||
(*) Goal (G): an ideal requirement above which further improvements are not necessary. Breakthrough (B): an intermediate level between threshold and goal which, if achieved, would result in a significant improvement for the targeted application. The breakthrough value may also indicate the level at which specified uses within climate monitoring become possible. It may be appropriate to have different breakthrough values for different uses. Threshold (T): the minimum requirement to be met to ensure that data are useful.
Data sources
This list provides sources for openly accessible data sets with worldwide coverage for which metadata is available. It is curated by the respective GCOS ECV Steward(s). The list does not claim to be complete. Anyone with a suitable dataset who wishes it to be added to this list should contact the abombelli wmo [dot] int (GCOS Secretariat).
- Global Terrestrial Network for Permafrost (GTN-P) Database

