Sea Surface Temperature


Global Sea Surface Temperature
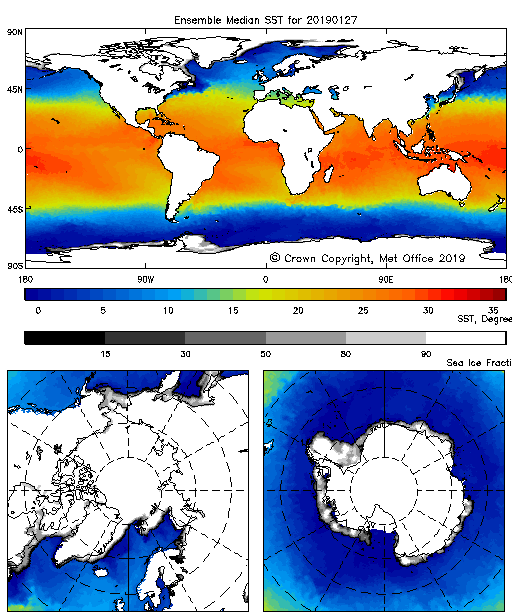
Ensemble Median Sea Surface Temperature for 29/01/2019. Source: www.ghrsst.org.; Each day the GHRSST Multi-product Ensemble ( GMPE ) experiment, coordinated by the GHRSST Inter-Calibration TAG (IC-TAG), produces a median SST map and associated standard deviation map using SST analysis data collected over the last 24 hour period (i.e. yesterday). Thus, the nominal analysis time for the GMPE median ensemble SST is 12:00Z for the previous day (i.e., T-1). The image data sets are updated each day ~13:30Z. The GMPE median ensemble SST map is computed as a median average using a variety of GHRSST L4 analysis products after their differing analysis grids have been homogenised by area averaging onto a standard 0.5° lat/lon grid. Although several analyses provide greater coverage (such as large lakes) the median-ensemble SST coverage is restricted by the use of the OSTIA analysis land mask. The GMPE median ensemble SST is currently derived using the following inputs: Met Office OSTIA SST analysis, NCEP RTG_SST_HR SST analysis, NAVOCEANO NAVO K10 SST observations, JMA MGDSST SST analysis, RSS RSS MW Fusion SST analysis, RSS RSS MW+IR Fusion SST analysis, FNMOC GHRSST-PP SST and sea Ice analysis, Ifremer ODYSSEA SST analysis, NOAA AVHRR OI (Reynolds), Meterological Service of Canada (CMC) 1/3 degree SST analysis, BMRC GAMSSA SST analysis. |
ECV Products and Requirements
These products and requirements reflect the Implementation Plan 2022 (GCOS-244).
The requirements are found in the complete 2022 ECVs Requirements document as well: ECV Sea-Surface Temperature.
| Products | Sea-Surface Temperature | ||
| (*) | Unit | Values | |
| Horizontal Resolution | G | km | 5 |
| B | |||
| T | 100 | ||
| Vertical Resolution | G | - | |
| B | - | ||
| T | - | ||
| Temporal Resolution | G | d | 1/24 |
| B | |||
| T | 7 | ||
| Timeliness | G | h | 3 |
| B | |||
| T | 24 | ||
| Required Measurement Uncertainty (2-sigma) | G | K | 0.05 |
| B | |||
| T | 0.3 | ||
| Stability | G | K/decade | 0.01 |
| B | |||
| T | 0.1 |
(*) Goal (G): an ideal requirement above which further improvements are not necessary. Breakthrough (B): an intermediate level between threshold and goal which, if achieved, would result in a significant improvement for the targeted application. The breakthrough value may also indicate the level at which specified uses within climate monitoring become possible. It may be appropriate to have different breakthrough values for different uses. Threshold (T): the minimum requirement to be met to ensure that data are useful
Data sources
This list provides sources for openly accessible data sets with worldwide coverage for which metadata is available. It is curated by the respective GCOS ECV Steward(s). The list does not claim to be complete. Anyone with a suitable dataset who wishes it to be added to this list should contact the abombelli wmo [dot] int (GCOS Secretariat).
- Group for High Resolution Sea Surface Temperature
- ECV Inventory by the CEOS/CGMS Working Group on Climate (WGclimate)

