Upper-air Temperature


Global Upper-air Temperature
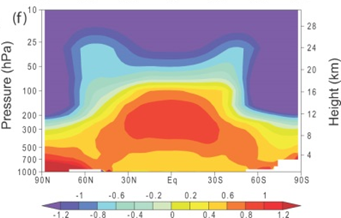
Figure: Zonal mean atmospheric temperature change from 1890 to 1999 (°C per century) as simulated by the PCM model as sum of solar forcing, volcanoes, well-mixed greenhouse gases, tropospheric and stratospheric ozone changes, direct sulphate and aerosol forcing. Plot is from 1,000 hPa to 10 hPa (shown on left scale) and from 0 km to 30 km (shown on right). Source : Adapted from Figure 9.1,IPCC, 2007: Climate Change 2007: The Physical Science Basis. Contribution of Working Group I to the Fourth Assessment Report of the Intergovernmental Panel on Climate Change [Solomon, S., D. Qin, M. Manning, Z. Chen, M. Marquis, K.B. Averyt, M. Tignor and H.L. Miller (eds.)]. Cambridge University Press, Cambridge, United Kingdom and New York, NY, USA, 996 pp. |
ECV Products and Requirements
These products and requirements reflect the Implementation Plan 2022 (GCOS-244).
The requirements are found in the complete 2022 ECVs Requirements document as well: ECV Upper-air Temperature.
| Products | Atmospheric Temperature in the | ||||||||
| Boundary Layer | Upper Troposphere and Lower Stratosphere | Free Troposphere | Middle and Upper Stratosphere | Mesosphere | |||||
| (*) | Unit | Values | Values | Unit | Values | Values | Values | ||
| Horizontal Resolution | G | km | 15 | 15 | km | 15 | 50 | 50 | |
| B | 100 | 100 | 100 | 100 | 100 | ||||
| T | 500 | 500 | 1000 | 1500 | 1500 | ||||
| Vertical Resolution | G | m | 1 | 25 | km | 0.01 | 0.5 | 0.5 | |
| B | 10 | 100 | 0.1 | 1 | 1 | ||||
| T | 100 | 250 | 1 | 3 | 3 | ||||
| Temporal Resolution | G | h | <1 | 1 | h | 1 | 1 | 1 | |
| B | 6 | 12 | 12 | 12 | 12 | ||||
| T | 12 | 24 | 24 | 24 | 24 | ||||
| Timeliness | G | h | 1 | 1 | h | 1 | 1 | 1 | |
| B | 3 | 3 | 3 | 3 | 3 | ||||
| T | 24 | 6 | 6 | 6 | 6 | ||||
| Required Measurement Uncertainty (2-sigma) | G | K | 0.1 | 0.1 | K | 0.1 | 0.1 | 0.1 | |
| B | 0.5 | 0.5 | 0.5 | 0.5 | 0.5 | ||||
| T | 1 | 1 | 1 | 1 | 1 | ||||
| Stability | G | K/decade | 0.01 | 0.01 | K/decade | 0.01 | 0.05 | 0.05 | |
| B | 0.05 | 0.02 | 0.02 | 0.1 | 0.1 | ||||
| T | 0.1 | 0.05 | 0.05 | 0.2 | 0.2 | ||||
(*) Goal (G): an ideal requirement above which further improvements are not necessary. Breakthrough (B): an intermediate level between threshold and goal which, if achieved, would result in a significant improvement for the targeted application. The breakthrough value may also indicate the level at which specified uses within climate monitoring become possible. It may be appropriate to have different breakthrough values for different uses. Threshold (T): the minimum requirement to be met to ensure that data are useful
Data sources
This list provides sources for openly accessible data sets with worldwide coverage for which metadata is available. It is curated by the respective GCOS ECV Steward(s). The list does not claim to be complete. Anyone with a suitable dataset who wishes it to be added to this list should contact the abombelli wmo [dot] int (GCOS Secretariat).
Gridded In Situ:
In Situ:
- Integrated Global Radiosonde Archive (IGRA)
- GCOS Reference Upper-Air Network (GRUAN)
- Radiosonde Atmospheric Temperature Products for Assessing Climate (RATPAC) 2
Reanalysis:
- REANALYSES.ORG (Inventory for Reanalysis)
Satellite:
- Satellite ECV Inventory by the CEOS/CGMS Working Group on Climate (WGClimate)