Subsurface Temperature


Ocean Heat Content
Figure 1: Global Ocean Heat Content Change (x 1022J) for the 0-700 metre layer: three-monthly means (red), and annual (black) and 5-year (blue) running means, from the US National Oceanic and Atmospheric Administration (NOAA) dataset. Prepared by WMO using data from the NOAA National Centers for Environmental Information. Source: WMO Statement on the state of the global climate in 2017 (http://library.wmo.int/opac/index.php?lvl=notice_display&id=20220#.WrOj…). |
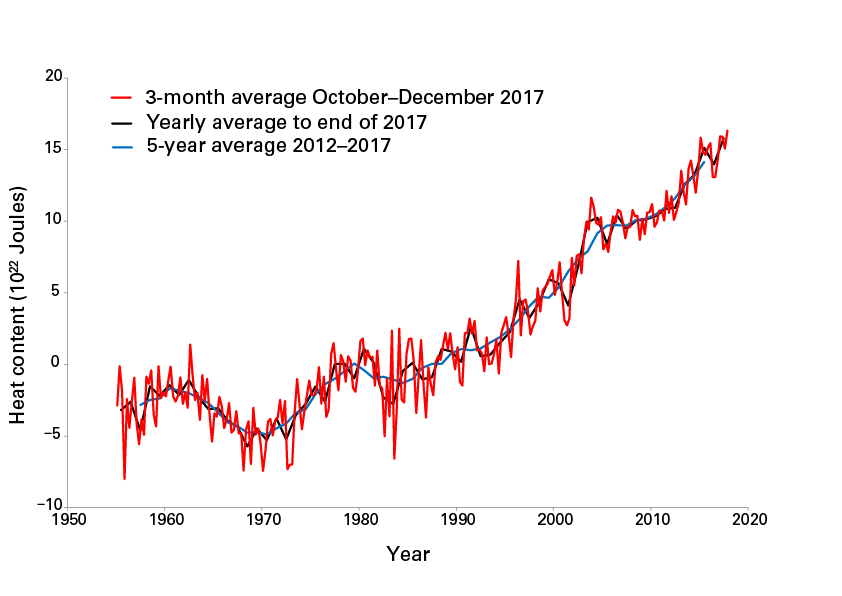
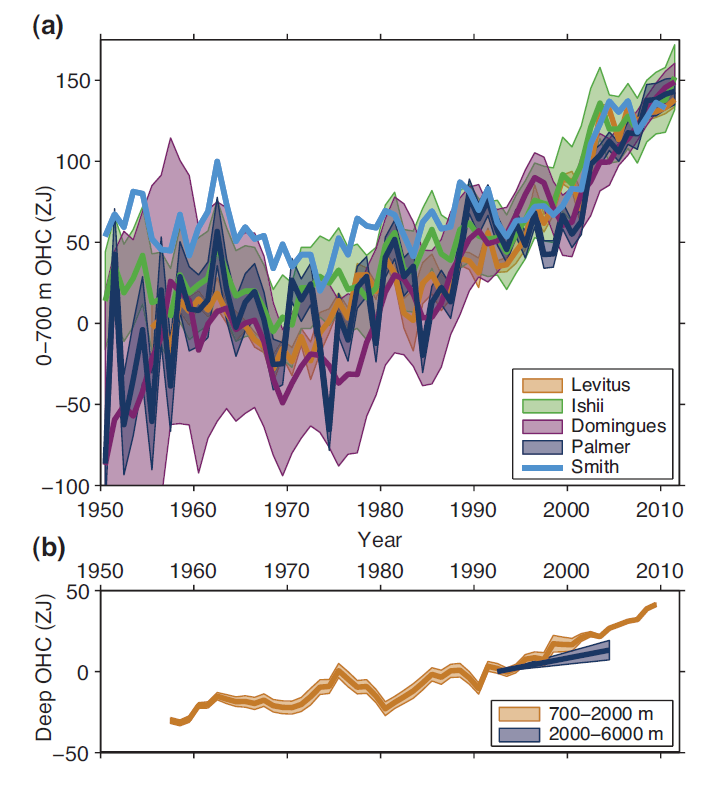
Figure 2: (a) Observation-based estimates of annual global mean upper (0 to 700m) ocean heat content in ZJ (1 ZJ = 1021 Joules) updated from (see legend): Levitus et al. (2012), Ishii and Kimoto (2009), Domingues et al. (2008), Palmer et al. (2007) and Smith and Murphy (2007). Uncertainties are shaded and plotted as published (at the one standard error level, except one standard deviation for Levitus, with no uncertainties provided for Smith). Estimates are shifted to align for 2006–2010, 5 years that are well measured by Argo, and then plotted relative to the resulting mean of all curves for 1971, the starting year for trend calculations. (b) Observation-based estimates of annual 5-year running mean global mean mid-depth (700 to 2000 m) ocean heat content in ZJ (Levitus et al., 2012) and the deep (2000 to 6000 m) global ocean heat content trend from 1992 to 2005 (Purkey and Johnson, 2010), both with one standard error uncertainties shaded (see legend). Reference: IPCC 5th Assessment Report, WG1 Ch3. Ocean Observations. |
ECV Products and Requirements
These products and requirements reflect the Implementation Plan 2022 (GCOS-244).
The requirements are found in the complete 2022 ECVs Requirements document as well: ECV Subsurface Temperature.
| Products | Interior Temperature | ||||
| Upper Ocean | Deep ocean | Coastal | |||
| (*) | Unit | Values | Values | Values | |
| Horizontal Resolution | G | km | 10 | 100 | 1 |
| B | 100 | 250 | |||
| T | 300 | 500 | 10 | ||
| Vertical Resolution | G | m | 1 | ||
| B | 2 | ||||
| T | 10 | ||||
| Temporal Resolution | G | d | 1 | 1 | 1/24 |
| B | 10 | 15 | |||
| T | 30 | 30 | 30 | ||
| Timeliness | G | d | 1 (real time), 90 (delayed mode) | ||
| B | 1 (real time), 180 (delayed mode) | ||||
| T | 30 (real time), 365 (delayed mode) | ||||
| Required Measurement Uncertainty (2-sigma) | G | K | 0.001 | 0.001 | |
| B | |||||
| T | 0.1 | 0.01 | 0.1 | ||
| Stability | G | K | |||
| B | |||||
| T | |||||
(*) Goal (G): an ideal requirement above which further improvements are not necessary. Breakthrough (B): an intermediate level between threshold and goal which, if achieved, would result in a significant improvement for the targeted application. The breakthrough value may also indicate the level at which specified uses within climate monitoring become possible. It may be appropriate to have different breakthrough values for different uses. Threshold (T): the minimum requirement to be met to ensure that data are useful
Data sources
This list provides sources for openly accessible data sets with worldwide coverage for which metadata is available. It is curated by the respective GCOS ECV Steward(s). The list does not claim to be complete. Anyone with a suitable dataset who wishes it to be added to this list should contact the abombelli wmo [dot] int (GCOS Secretariat).
- The Global Temperature and Salinity Profile Programme (GTSPP)
- As a part of NCEI Data Center consolidation, the GTSPP infrastructure is being physically moved to Asheville North Carolina.